Bring key signals together
Review bookings, revenue, table turnover, and labour context in one place.
Operational insight
Turn day-to-day activity into a clearer view of what is working and where to adjust.
Inside the platform
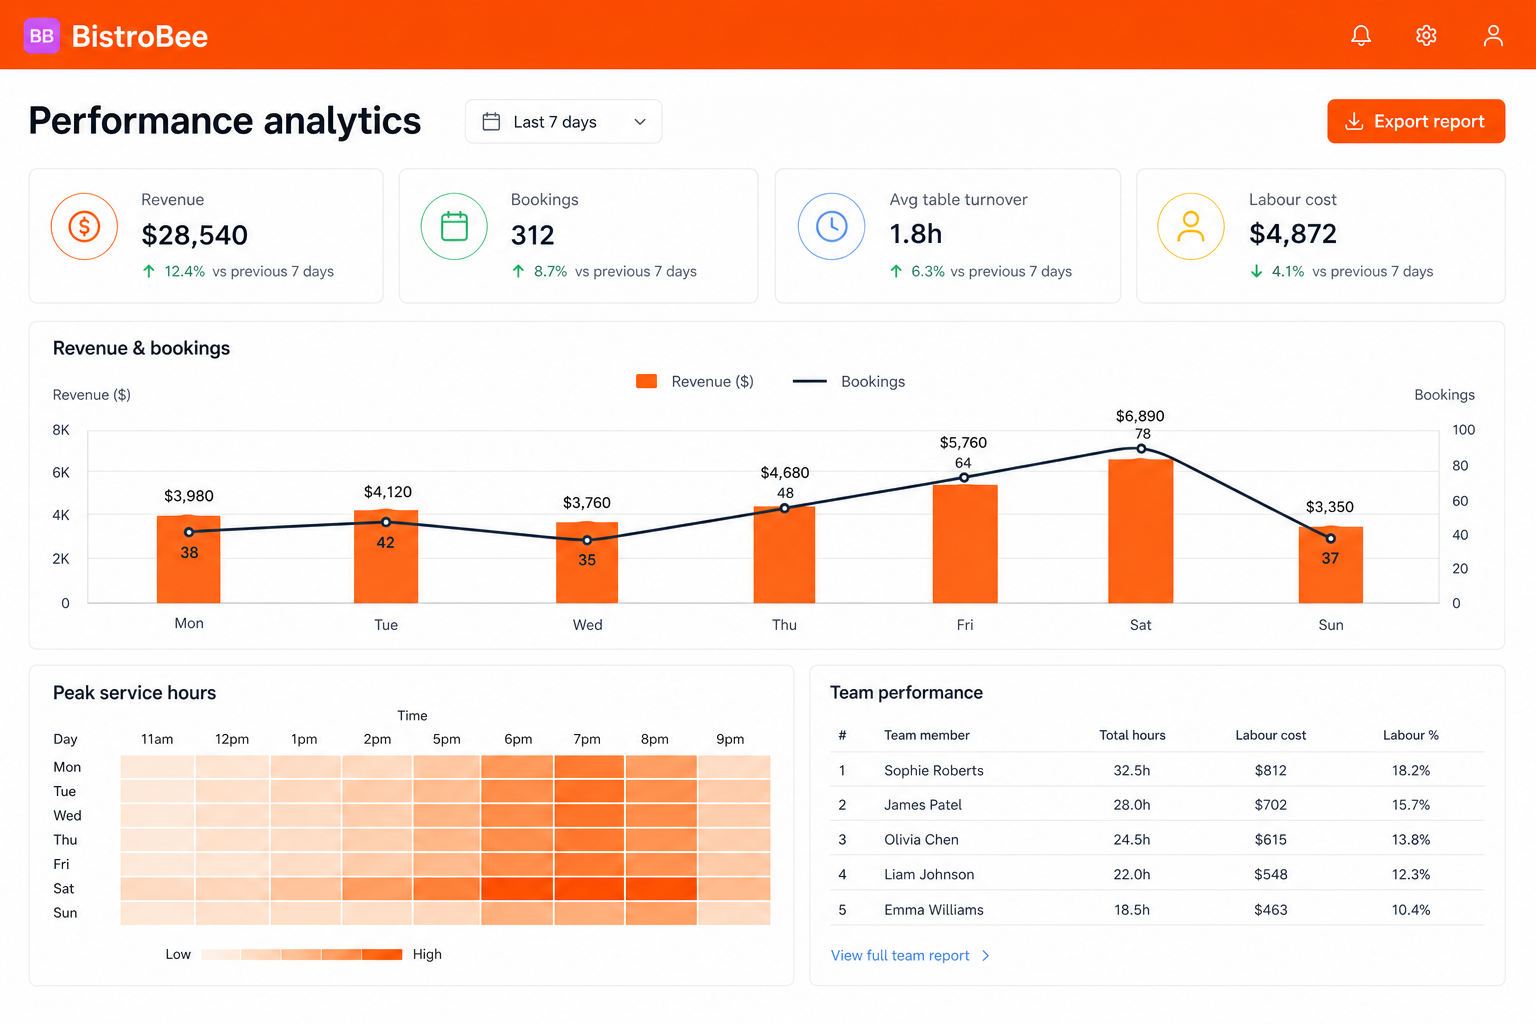
This illustrative product view shows how performance analytics keeps the relevant people, details, and next actions together.
Why it matters
Review bookings, revenue, table turnover, and labour context in one place.
See how demand and performance change across days and peak hours.
Use operating trends to shape the next roster, floor plan, or service decision.
How it works
A focused workflow keeps the operational detail visible without making the process heavier.
Focus the dashboard on the service window or reporting period that matters.
Read guest demand, turnover, staffing, and revenue patterns together.
Export a clear report or carry the findings into the next operating plan.
Your next service
See how BistroBee can bring your team, bookings, tables, and venue performance into one operational view.